
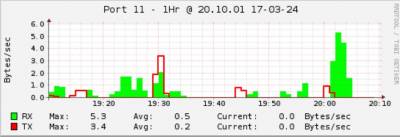
With LinBPQ you can make graphs for the traffic flow through your node. You can use this technique or you can grab the SNMP data and use it via any other SNMP graphing tool.
LinBPQ has the following OID's
IfINOctets  = 1.3.6.1.2.1.2.2.1.10.<port>
IfOUTOctets = 1.3.6.1.2.1.2.2.1.16.<port>
SysUpTime   = 1.3.6.1.2.1.1.3.0
SysName     = 1.3.6.1.2.1.1.5.0
The way I have set things up works like this:
linbpq SNMP interface → updatescript → rrdtool (created graphs) → webpage & images
You need a webserver (bpq built-in will work) and the following software installed
rrdtool
snmp
- Create an RRDTOOL dBase file for each port you want to monitor
rrdtool create port2.rrd --step=60 \
DS:in:DERIVE:120:U:U \
DS:out:DERIVE:120:U:U \
RRA:AVERAGE:0.5:1:10080 \
RRA:AVERAGE:0.5:5:25920 \
RRA:AVERAGE:0.5:30:9000 \
RRA:AVERAGE:0.5:120:2250 \
RRA:AVERAGE:0.5:1440:797 \
- You need to enable SNMP in bpq32.cfg. You can do it two ways, either inside TELNET config, or inside IPGATEWAY
- TELNET In the telnet configuration section, add
SNMPPORT=161
e.g.
PORT
 PORTNUM=3
 ID=Telnet Server
 DRIVER=Telnet
 CONFIG
 SecureTelnet=1
 LOGGING=1
 DisconnectOnClose=1
 TCPPORT=8010
 FBBPORT=8011
 HTTPPORT=9122
 SNMPPORT=161
ENDPORT
- IPGATWEAY The IP's used here are for example only. If you setup linBPQ for 44-net, please use all the proper IP's allocated to you. 192.168.1.44 - unused on the LAN (not the node's IP address) 44.131.1.1 - if you don't have a 44 address, you can use this because you dont have it will only be local If you dont route to the rest of the 44 subnet
IPGATEWAY
  Adapter eth0
  44ENCAP 192.168.1.44
  IPADDR 44.131.1.1
  ENABLESNMP
****
- Then from the same, or another machine
(Note, you may have to add a route. This can be a service, or a cron script)
#!/bin/bash

sleep 60

#Adding rule to linbpq instance
sudo route add 44.131.1.1 gateway 192.168.1.44

while true;
do

PortList="2,4,5,6,7,10,11"
Field_Separator=$IFS

# set comma as internal field separator for the string list
IFS=,
for val in $PortList;
 do
  echo update port$val.rrd

  in=$(snmpget -r5 -Oqv -v1 -c public 44.131.253.72  1.3.6.1.2.1.2.2.1.10.$val )
  sleep 0.25
  out=$(snmpget -r5 -Oqv -v1 -c public 44.131.253.72  1.3.6.1.2.1.2.2.1.16.$val )
  echo $in $out

  rrdtool update port${val}.rrd N:$in:$out
  sleep 0.75
 done

IFS=$Field_Separator

sleep 60
done
- Run the next as a cron job
#!/bin/bash

cd /home/pi/linbpq/graphs
now=$(date +"%H.%M.%S %d-%m-%y")

PortList="2,4,5,6,7,10,11"
Field_Separator=$IFS

# set comma as internal field separator for the string list
IFS=,
for val in $PortList;
 do

 echo Creating Port${val}

        rrdtool graph port${val}_1hr.png \
        --width 450 \
        --height 100 \
        --end now --start end-3600s \
        --title "Port ${val} - 1Hr @ $now" \
        -v "Bytes/sec" \
        DEF:in=port${val}.rrd:in:AVERAGE \
        DEF:maxin=port${val}.rrd:in:MAX \
        DEF:out=port${val}.rrd:out:AVERAGE \
        DEF:maxout=port${val}.rrd:out:MAX \
        AREA:in#00ff00:RX \
        GPRINT:in:MAX:" Max\\: %6.1lf %s" \
        GPRINT:in:AVERAGE:" Avg\\: %6.1lf %S" \
        GPRINT:in:LAST:" Current\\: %6.1lf %SBytes/sec\\n" \
        LINE2:out#ff0000:TX \
        GPRINT:out:MAX:" Max\\: %6.1lf %s" \
        GPRINT:out:AVERAGE:" Avg\\: %6.1lf %S" \
        GPRINT:out:LAST:" Current\\: %6.1lf %SBytes/sec\\n"


        rrdtool graph port${val}_24hrs.png \
        --width 450 \
        --height 100 \
        --end now --start end-43200s \
        --title "Port ${val} - 24Hr @ $now" \
        -v "Bytes/sec" \
        DEF:maxin=port${val}.rrd:in:MAX \
        DEF:maxout=port${val}.rrd:out:MAX \
        DEF:in=port${val}.rrd:in:AVERAGE \
        DEF:out=port${val}.rrd:out:AVERAGE \
        AREA:in#00ff00:RX \
        GPRINT:in:MAX:" Max\\: %6.1lf %s" \
        GPRINT:in:AVERAGE:" Avg\\: %6.1lf %S" \
        GPRINT:in:LAST:" Current\\: %6.1lf %SBytes/sec\\n" \
        LINE2:out#ff0000:TX \
        GPRINT:out:MAX:" Max\\: %6.1lf %s" \
        GPRINT:out:AVERAGE:" Avg\\: %6.1lf %S" \
        GPRINT:out:LAST:" Current\\: %6.1lf %SBytes/sec\\n"


 done

IFS=$Field_Separator

#copy images to the webserver location
sudo cp *.png /var/www/html/
- This is a really simple Webpage, which could be made a lot better (i.e. pull a cfg file with the ports and process those dynamically rather than have static entries for each, or just define them at the top of the JS) :
<HTML>
<head>
<script>

function update() {

    var imgs = document.getElementsByTagName("img");
    var imgSrcs = [];
    for (var i = 0; i < imgs.length; i++) {
        imgs[i].src = imgs[i].src +  new Date().getTime();
    }
    document.getElementById("lastupdated").innerHTML="Last Updated: " + Date();

setTimeout( function () { update() } , 300000);

}

setTimeout( function () { update() } , 300000);

</script>
</head>
<BODY>
<br>

<img src="port2_1hr.png?">
<img src="port2_24hrs.png?">
<br>
<img src="port4_1hr.png?">
<img src="port4_24hrs.png?">
<br>
<img src="port5_1hr.png?">
<img src="port5_24hrs.png?">
<br>
<img src="port6_1hr.png?">
<img src="port6_24hrs.png?">
<br>
<img src="port7_1hr.png?">
<img src="port7_24hrs.png?">
<br>
<img src="port10_1hr.png?">
<img src="port10_24hrs.png?">
<br>
<img src="port11_1hr.png?">
<img src="port11_24hrs.png?">
<br>
<p id="lastupdated">Last Updated: never</p>
</BODY>
<script>

document.getElementById("lastupdated").innerHTML="Last Updated: " + Date();
</script>
</HTML>