This is an old revision of the document!
Table of Contents
How to use WebSDR sites
This page is intended to serve as a basic guide for using 'WebSDR' to listen to radio activity in your web browser. If you want to learn how to setup your own SDR, click here.
What is SDR?
 An example of a spectrogram 'waterfall' showing a section of the 2m band. The left most column is a strong signal of someone speaking using FM, with other transmissions to the right of it. Different sorts of transmissions (or interference) appear differently and you can learn to differentiate them just by looking.
'SDR' or 'Software-Defined Radio' is a radio system where part of the radio's operation is handled by software instead of the more typical analogue components. One of the main benefits to using an SDR is that it enables you to use an interface on a computer to control a radio and its operation. You could, for example, use a computer headset/microphone to speak with your radio, or use a keyboard as the 'PTT' button. Another feature which is ubiquitous to SDR software is being able to view a 'spectrogram', where you can see a visual representation of part of the radio spectrum. You will likely hear spectrograms referred to as 'waterfalls' because the spectrum is often displayed in a way where it moves vertically, although there are other layouts available.
What is WebSDR?
'WebSDR' is a worldwide system of internet-connected SDR receivers which allow you to listen to various radio bands and view a waterfall in your browser. It was developed by Dr. ir. Pieter-Tjerk de Boer (PA3FWM), a Dutch associate Professor at the University of Twente. The website has a list of available SDRs which you can filter by band and region, as well as a worldwide map at the very bottom of the page. WebSDR differs from some other internet-connected SDRs in that many users can access the recievers independently and tune to different signals. There are some other systems available now which are similar in this aspect, such as 'KiwiSDR'.
How to get started
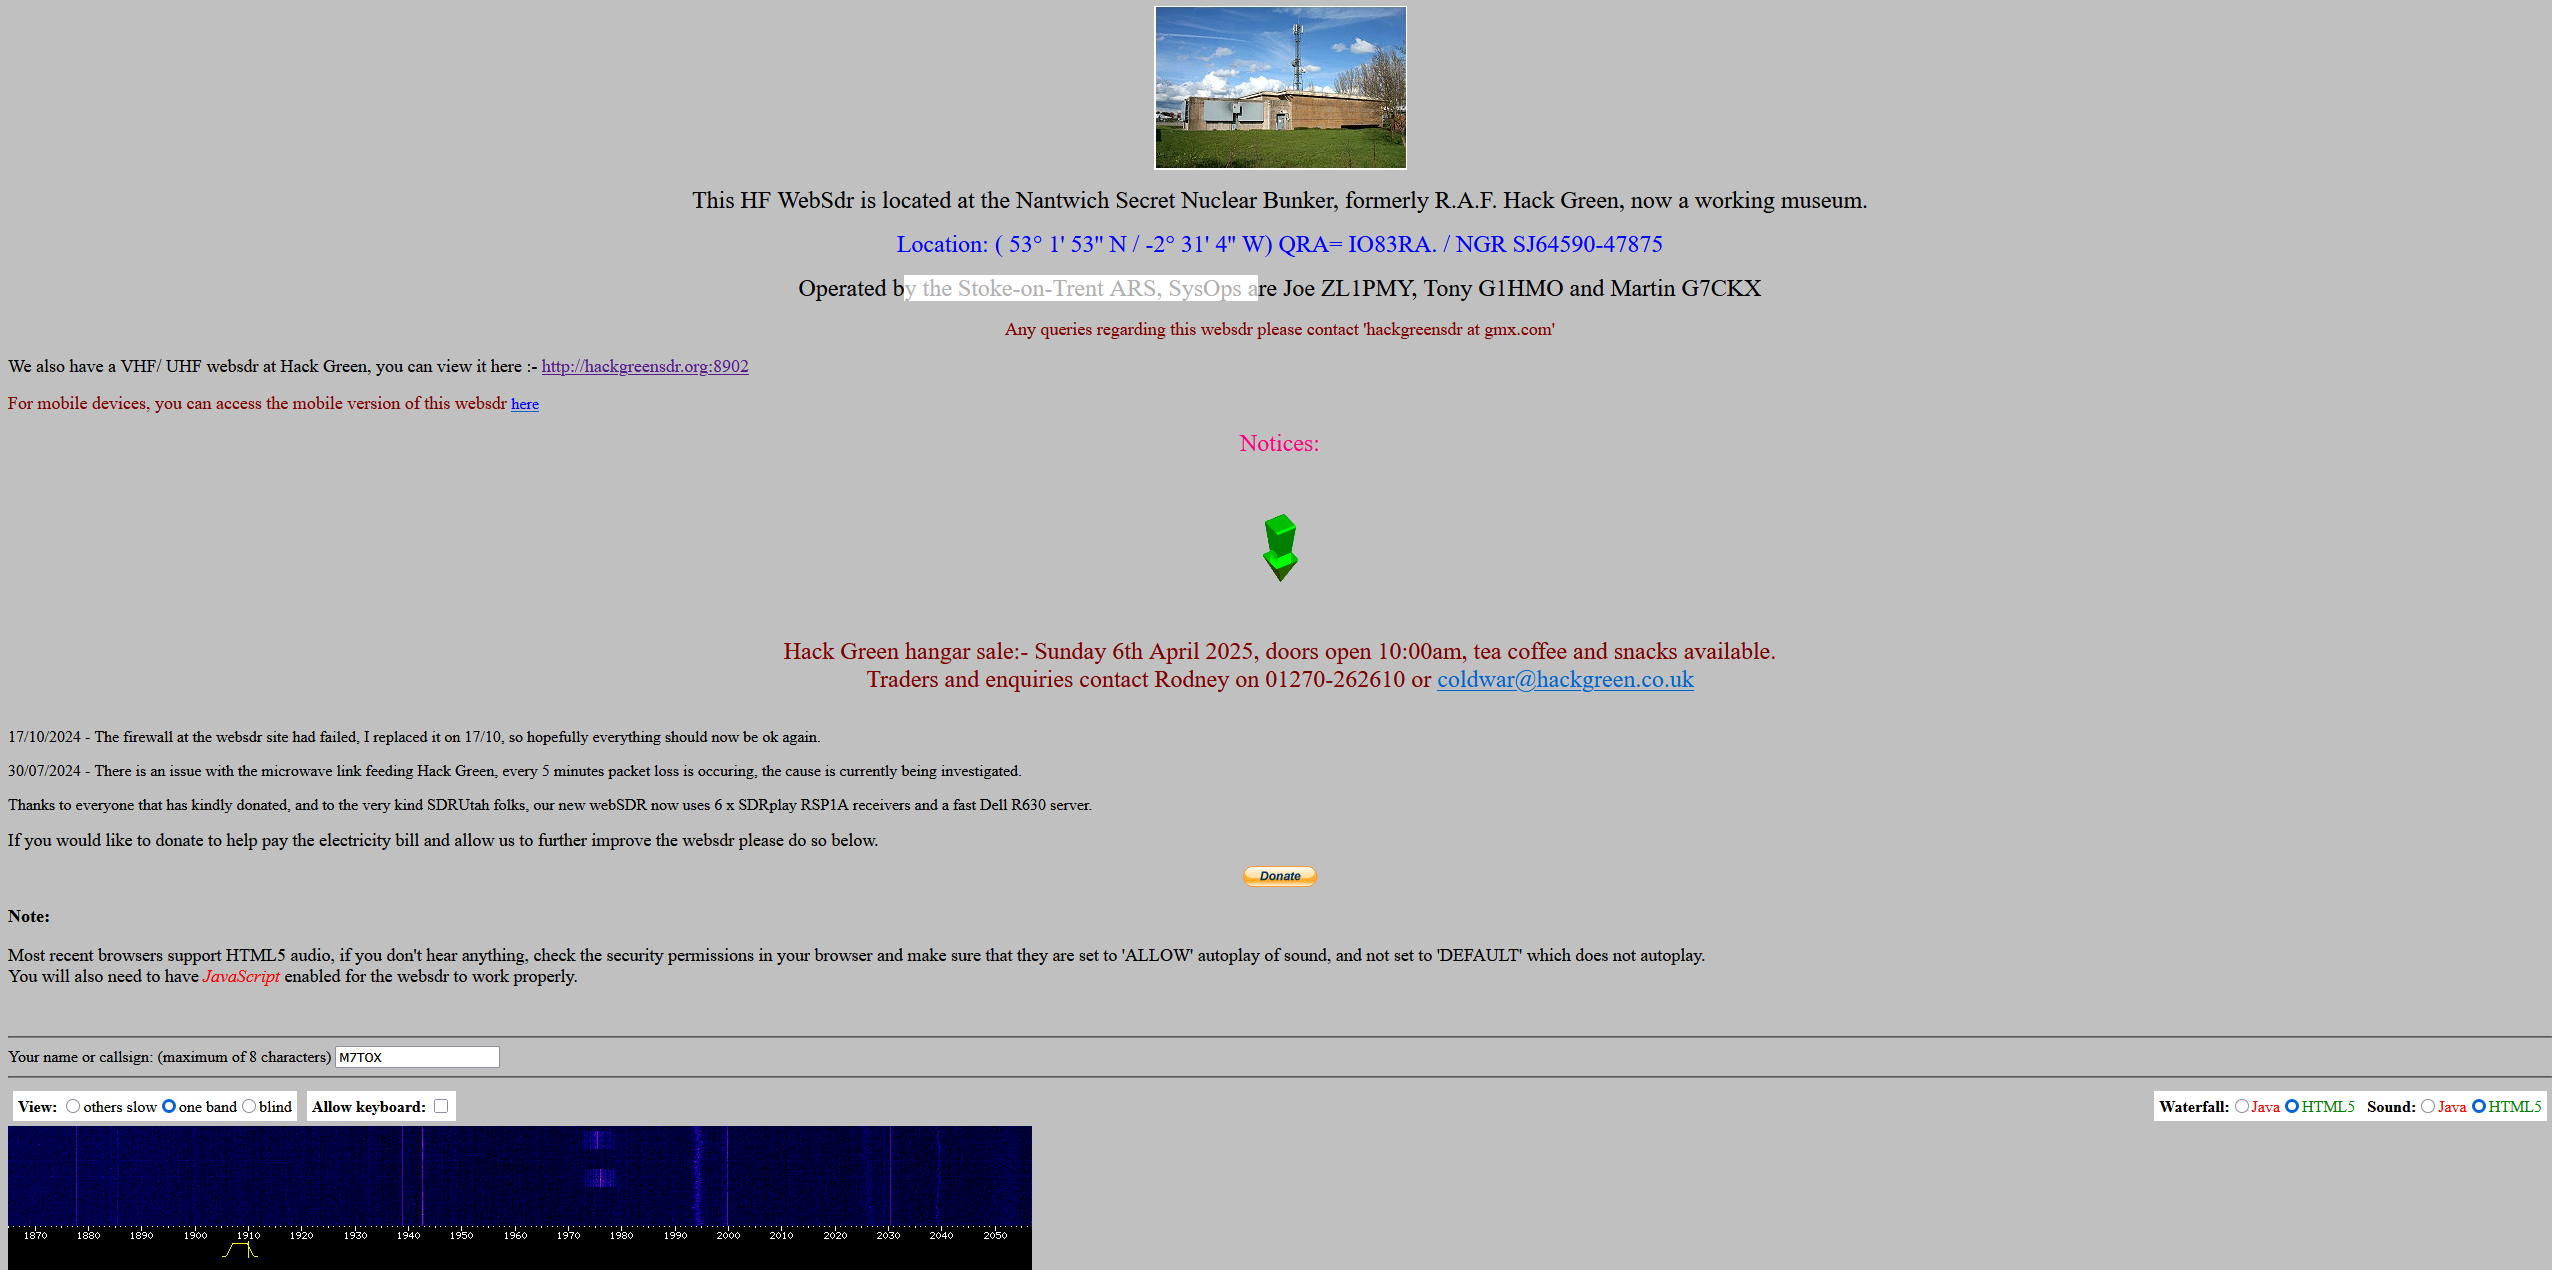
 The Hack Green website, in all its web 1.0 glory. (Note: this is the HF site, there is a link at the top to switch to the VHF one instead.)
Getting started is as easy as selecting an SDR from the list, though for this guide we will be using the Hack Green SDR, which is based in the sunny county of Cheshire, England. It may be easier to follow along using this, as there are some visual differences between the different sites. Hopefully, once you are comfortable with using this one, you can experiment with the others and find your own way.
You should hear the SDR audio as soon as you open the page, likely just static. A note at the top of the page states that Firefox users might have to change permissions to allow websites to auto-play audio but I've never had an issue with this. There are some radio buttons1) to change if the waterfall and/or audio use Java or HTML5. It defaults to HTML5 and the vast majority of users likely want to keep it that way, as Java isn't natively supported in many browsers anymore.
Once you are hearing sound and seeing a waterfall, you're ready to start.
Interface:
Name
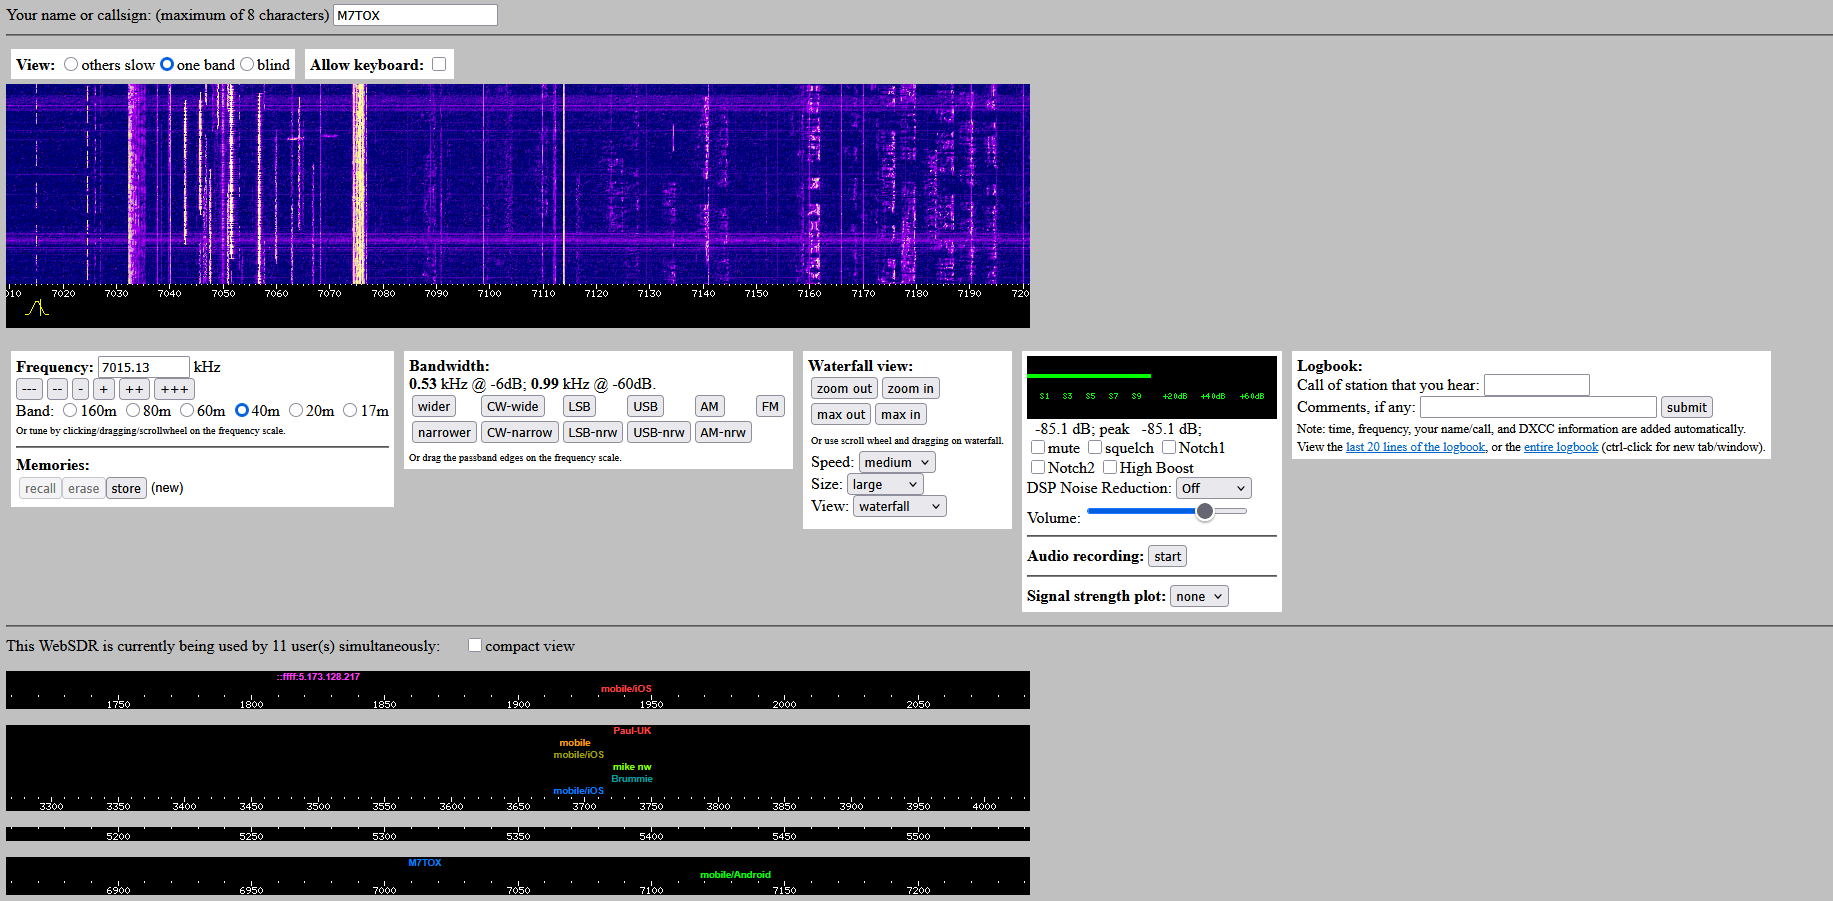
First off, you may want to add your name/alias/callsign in the box above the waterfall, if you leave it blank then you will get a generic one. You can view other users in the black rows beneath the waterfall. The different rows are each a different band of HF, with the white numbers being the frequency. The colourful names are other users who are listening, with their position correlating to the frequency they are tuned to. You can see my callsign (M7TOX) on the 4th row, between 7000 and 7050. You may find it useful to try and tune to where others are listening, because if there's a few people listening then there's likely something happening on that frequency.
Waterfall controls
- Zoom in and out with the scroll wheel whilst your mouse is over the waterfall.
- Click the scroll wheel and drag left or right to move the waterfall without changing what you're tuned to.
- Left clicking somewhere underneath the white frequency numbers will tune you to that area.
- Hovering your mouse over the yellow bandpass will highlight the middle or the sides. Highlighting the side and clicking lets you drag the boundaries wider or narrower, whilst hovering in the middle and clicking will let you move the whole thing by dragging.
Frequency
You can manually enter a frequency here, which may be easier if you want to be exact. The input is limited by the band you are on, so if you try and enter 6000 on the 40m band, it won't tune because that's outside the limit (there is a little leeway either side though). The buttons below the input box are useful for nudging the frequency up or down by a little '+', a bit more '++', or quite a lot '+++'. I recommend using these little buttons for fine tuning as it's a bit easier than dragging with the mouse.
Band
The radio buttons here let you switch between the different available bands. Don't forget that HF band availability vary at different times of day and due to various magical (scientific) reasons, so some bands may seem quiet if that band is 'closed'. Have a look online for HF band availability for the current forecast.
Bandwidth
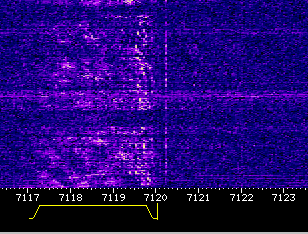
 The yellow bandpass set to Lower side band mode and placed over the signal in a way that the audio is readable. Note the vertical bar on the right is placed just on the side of the signal, whilst the horizontal line is approximately the width of the signal.
This bit is potentially the easiest bit to get wrong as a beginner. They are arranged in columns, if that wasn't evident, and you probably want to avoid the wider/narrower ones on the left in most instances. 'CW'2) is for morse, 'LSB'3) is used for frequencies below 10MHz, 'USB'4) is for frequencies above 10MHz, AM and FM are probably self explanatory. You may find that for these various options, the wide/narrow options improve how well you can hear the signal, though generally it's fine on the 'standard' setting rather than the 'narrow' one.
Waterfall view
Zooming can be done here if you don't have a scroll wheel. You can set the speed of the waterfall, though I find medium is fine. Fast seems to make things dissapear a little too quickly for me but that's just preference. I recommend changing the size to large. The view here can be changed from the standard waterfall view to 'weak signals' or 'strong signals', it mostly changes the background noise visability to make seeing one or the other a bit easier. There is also an option for 'Spectrum', which you can see below. It's more 'real-time' than the waterfall, meaning you can't see what happened a few seconds ago, but areas where the spectrum is taller is where things are happening. You also can't really tell what a signal is just from looking at it, so it's potentially less useful.

The audio panel
The panel next to the 'waterfall view' has a few different options.
- The green bar shows the signal strength, which is what people use to give readability/signal reports. When you hear someone say '5/9', the '9' bit is because the green bar here reads 9, and is a feature on lots of radios, analogue or SDR.
- Mute: I'm sure you can work this one out on your own :)
- squelch: This turns a squelch function on, filtering out the static in the background and only playing audio when the signal strength is high enough the software feels there is a transmission. If squelch is ticked on, but you can't hear anything when the waterfall looks as though there is something there, try turning it off. There may be a faint signal that the squelch is blocking.
- Notch1/Notch2: two options for trying to filter out unwanted beeps and noises, you can use one, both, or none. I don't find it particularly useful.
- High Boost: Might make quiet signals easier to hear.
- DSP Noise Reduction: Might make signals less static-y, or easier to hear. Try it in combination with High boost if you like.
- Audio Recording: If you click start, it will start recording the audio output and when you click stop it will produce a dowload link. Note: It also makes an error message on my browser, but still works fine if you click the download button, so your mileage may vary.
Logbook
You can log callsigns of heard stations and a comment here if you like. The buttons here also let you see the logbook itself. Interesting to have a read through to notice patterns or clusters of transmissions, or if you're wondering if anyone heard your own transmissions.

