
Table of Contents
Monitoring LinBPQ through SNMP
Enable SNMP on LinBPQ
N.B. This approach requires a recent version of LinBPQ, 6.0.24.34 or later. Older releases supported SNMP through the IPGATEWAY feature - see snmp_graphs
In the config for your telnet port, look for the existing TCPPORT block and add and extra line SNMPPORT=161, something like this:
  TCPPORT=8010
  FBBPORT=8011
  HTTPPORT=8008
  SNMPPORT=161
  LOGINPROMPT=user:
Restart BPQ to enable. LinBPQ supports the following OIDs:
IfINOctets  = 1.3.6.1.2.1.2.2.1.10.<port>
IfOUTOctets = 1.3.6.1.2.1.2.2.1.16.<port>
SysUpTime   = 1.3.6.1.2.1.1.3.0
SysName     = 1.3.6.1.2.1.1.5.0
If you have snmp installed locally you should be able to see data imediately:
$ snmpget -r5 -Oqv -v1 -c public localhost  1.3.6.1.2.1.2.2.1.10.2
79322
Set up monitoring in Home Assistant
One way to monitor BPQ's SNMP metrics is using Home Assistant.
SNMP support is built-in to HA but requires hand-editing configuration.yaml. If you are not comfortable doing that, stop now!
Add a sensor for each port you are interested in and restart HA to enable them:
sensor:
  - platform: snmp
    accept_errors: true
    unit_of_measurement: "B"
    state_class: total_increasing
    icon: mdi:cloud-download
    name: "Packet Port 1 Octets In"
    unique_id: sensor.snmp_packet_port_1_octets_in
    host: 192.168.1.14
    baseoid: 1.3.6.1.2.1.2.2.1.10.1

  - platform: snmp
    accept_errors: true
    unit_of_measurement: "B"
    state_class: total_increasing
    icon: mdi:cloud-upload
    name: "Packet Port 1 Octets Out"
    unique_id: sensor.snmp_packet_port_1_octets_out
    host: 192.168.1.14
    baseoid: 1.3.6.1.2.1.2.2.1.16.1
2.1 Traffic Graphs
I use the Statistics Graph Card to monitor traffic in and out on each port:
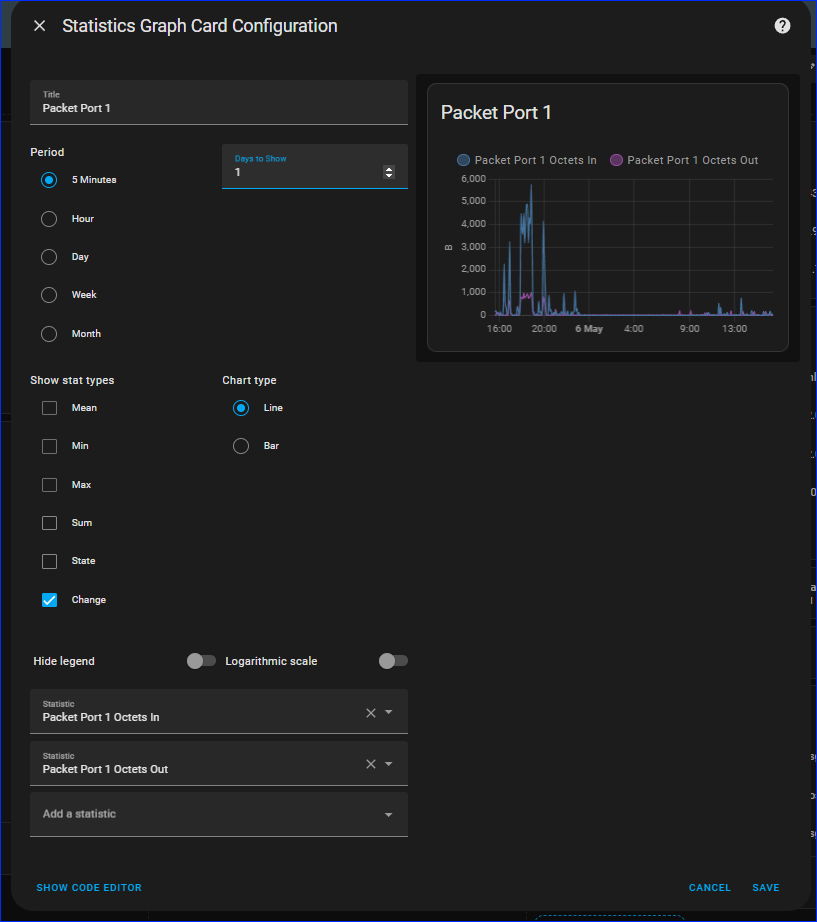
Or if you prefer, here's the card configuration:
chart_type: line
period: 5minute
type: statistics-graph
entities:
  - sensor.packet_port_1_octets_in_2
  - sensor.packet_port_1_octets_out_2
days_to_show: 1
title: Port 1
stat_types:
  - change
hide_legend: true
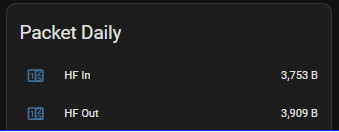
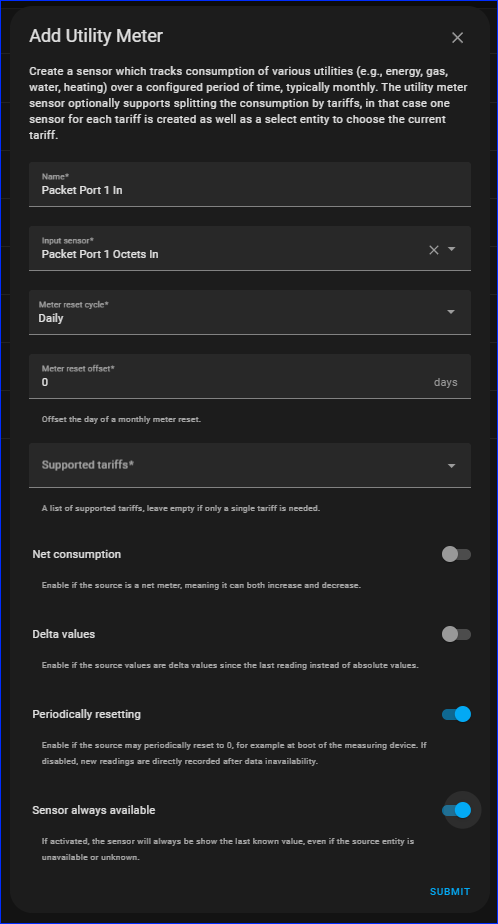
2.2 Daily Counters
I have set up counters for each port:
Go to Settings, Helpers, Create Helper and choose Utility Meter. Get this right first go as you don't seem to be able to go back and edit all the features - in particular the reset cycle…
2.3 CPU Temperature
I may have got carried away with monitoring (and Pi's…) but you can also add an OID for CPU temperature to each of your Pi's - see this article.
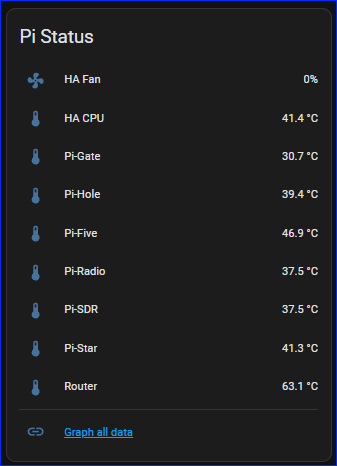
The SNMP setup in HA is similar to before, but the temperature returned is is actually in milli-centigrade (if that's a unit!) so I added a Template Sensor to get actual °C:
sensor:
  - platform: snmp
    accept_errors: true
    unit_of_measurement: "°C"
    device_class: temperature
    state_class: measurement
    icon: mdi:thermometer
    name: "CPU Temp - SNMP - Pi-Radio"
    unique_id: sensor.snmp_cpu_temp_pi_radio
    host: 192.168.99.14
    port: 8161
    baseoid: 1.3.6.1.2.1.25.1.8

template:
  - sensor:
      - name: "Pi-Radio CPU"
        unique_id: sensor.cpu_temp_pi_radio
        state: "{{ (states('sensor.cpu_temp_pi_radio_2') | float() / 1000) | round(1) }}"
        unit_of_measurement: "°C"
        icon: mdi:thermometer
        state_class: measurement
        device_class: temperature
Telegraf / Grafana
Another way to collect and monitor BPQ's SNMP metrics is by using Telegraf. You typically run Telegraf as part of a monitoring stack, in this case Telegraf + InfluxDB + Grafana. Telegraf is the collection agent, InfluxDB is the time-series database, and Grafana is the visualisation.
In telegraf.conf:
[[inputs.snmp]]
  agents = ["udp4://localhost:161"]
  version = 1

# for each port...

[[inputs.snmp.field]]
  oid = "1.3.6.1.2.1.2.2.1.10.1"
  name = "port_1_octets_in"
  conversion = "int"

[[inputs.snmp.field]]
  oid = "1.3.6.1.2.1.2.2.1.16.1"
  name = "port_1_octets_out"
  conversion = "int"
These counters show up in InfluxDB under a measurement named SNMP with multiple fields, one for each oid. You get a counter update every 10 seconds.
Query like this:

End result:

Prometheus
It's also quite easy to get prometheus-snmp-exporter to collect stats from BPQ.
Add something like the following to your generator.yml
  linbpq:
    walk:
      - 1.3.6.1.2.1.1.3.0
      - 1.3.6.1.2.1.1.5
      - 1.3.6.1.2.1.2.2.1.10.1
      - 1.3.6.1.2.1.2.2.1.16.1
    version: 1
    auth:
      community: public
Repeat the 1.3.6.1.2.1.2.2.1.10.X and 1.3.6.1.2.1.2.2.1.16.X lines for each of your ports, then run prometheus-snmp-generator generate to regenerate your configuration.
You'll likely already have an snmp scrape configuration in your prometheus.yml. Add the linbpq module (as defined above) and the target address of your BPQ node to it. The result will look something like this:
  - job_name: 'snmp'
    scrape_interval: 20s
    scrape_timeout: 5s
    metrics_path: /snmp
    params:
      module: [linbpq]
    static_configs:
      - targets:
        - packet.example.org:8161  # SNMP device - add your IPs here
    relabel_configs:
      - source_labels: [__address__]
        target_label: __param_target
      - source_labels: [__param_target]
        target_label: instance
      - target_label: __address__
        replacement: 127.0.0.1:9116  # SNMP exporter.
After restarting prometheus-snmp-exporter and prometheus you should start seeing ifInOctets, ifOutOctets, sysName, and sysUpTime metrics appearing.