
This is an old revision of the document!
Table of Contents
Monitoring LinBPQ through SNMP
Enable SNMP on LinBPQ
N.B. This approach requires a recent version of LinBPQ, 6.0.24.34 or later. Older releases supported SNMP through the IPGATEWAY feature - see snmp_graphs
In the config for your telnet port, look for the existing TCPPORT block and add and extra line SNMPPORT=161, something like this:
  TCPPORT=8010
  FBBPORT=8011
  HTTPPORT=8008
  SNMPPORT=161
  LOGINPROMPT=user:
Restart BPQ to enable. LinBPQ supports the following OIDs:
IfINOctets  = 1.3.6.1.2.1.2.2.1.10.<port>
IfOUTOctets = 1.3.6.1.2.1.2.2.1.16.<port>
SysUpTime   = 1.3.6.1.2.1.1.3.0
SysName     = 1.3.6.1.2.1.1.5.0
If you have snmp installed locally you should be able to see data imediately:
$ snmpget -r5 -Oqv -v1 -c public localhost  1.3.6.1.2.1.2.2.1.10.2
79322
Set up monitoring in Home Assistant
One way to monitor BPQ's SNMP metrics is using Home Assistant.
SNMP support is built-in to HA but requires hand-editing configuration.yaml. If you are not comfortable doing that, stop now!
Add a sensor for each port you are interested in and restart HA to enable them:
sensor:
  - platform: snmp
    accept_errors: true
    unit_of_measurement: "B"
    state_class: total_increasing
    icon: mdi:cloud-download
    name: "Packet Port 1 Octets In"
    unique_id: sensor.snmp_packet_port_1_octets_in
    host: 192.168.1.14
    baseoid: 1.3.6.1.2.1.2.2.1.10.1

  - platform: snmp
    accept_errors: true
    unit_of_measurement: "B"
    state_class: total_increasing
    icon: mdi:cloud-upload
    name: "Packet Port 1 Octets Out"
    unique_id: sensor.snmp_packet_port_1_octets_out
    host: 192.168.1.14
    baseoid: 1.3.6.1.2.1.2.2.1.16.1
2.1 Traffic Graphs
I use the Statistics Graph Card to monitor traffic in and out on each port:
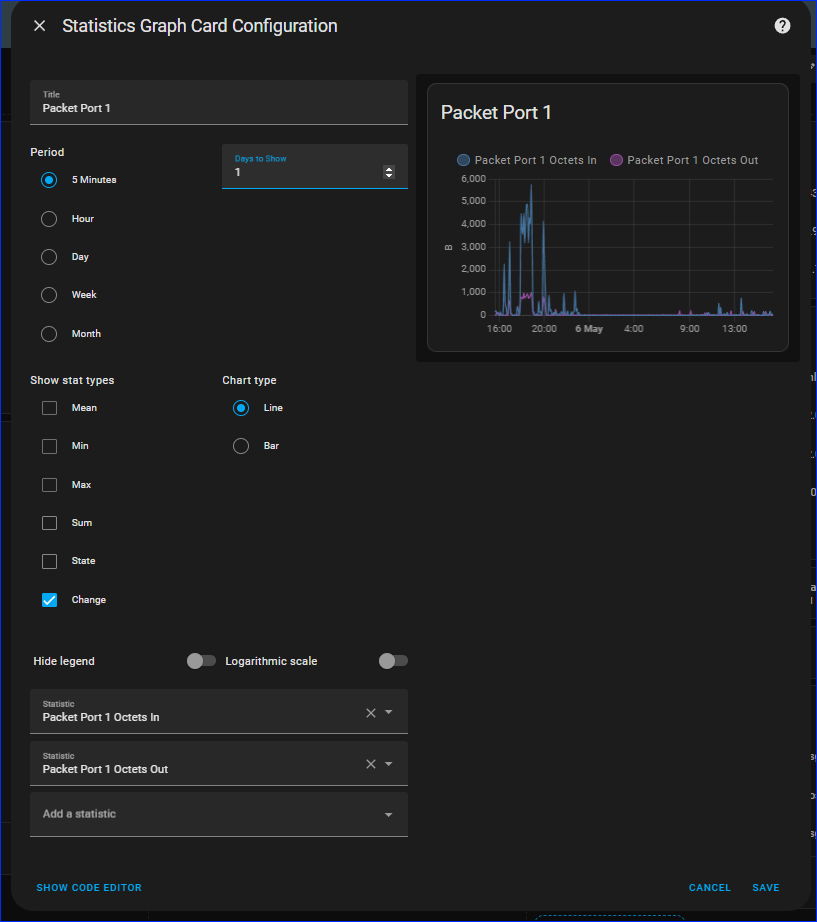
Or if you prefer, here's the card configuration:
chart_type: line
period: 5minute
type: statistics-graph
entities:
  - sensor.packet_port_1_octets_in_2
  - sensor.packet_port_1_octets_out_2
days_to_show: 1
title: Port 1
stat_types:
  - change
hide_legend: true
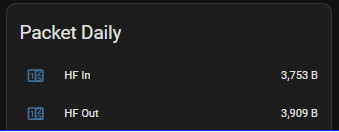
2.2 Daily Counters
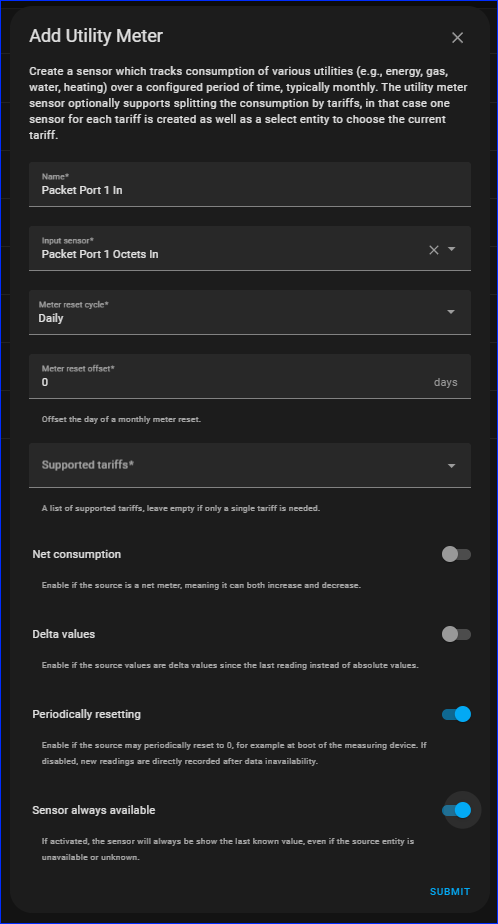
I have set up counters for each port:
Go to Settings, Helpers, Create Helper and choose Utility Meter. Get this right first go as you don't seem to be able to go back and edit all the features - in particular the reset cycle…
2.3 CPU Temperature
I may have got carried away with monitoring (and Pi's…) but you can also add an OID for CPU temperature to each of your Pi's - see this article.
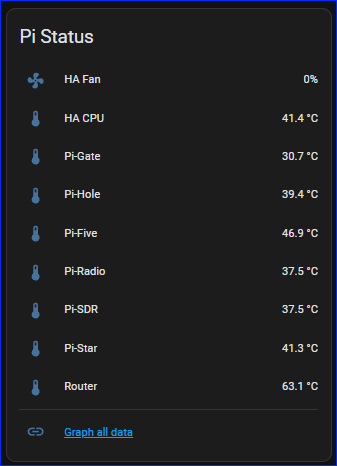
The SNMP setup in HA is similar to before, but the temperature returned is is actually in milli-centigrade (if that's a unit!) so I added a Template Sensor to get actual °C:
sensor:
  - platform: snmp
    accept_errors: true
    unit_of_measurement: "°C"
    device_class: temperature
    state_class: measurement
    icon: mdi:thermometer
    name: "CPU Temp - SNMP - Pi-Radio"
    unique_id: sensor.snmp_cpu_temp_pi_radio
    host: 192.168.99.14
    port: 8161
    baseoid: 1.3.6.1.2.1.25.1.8

template:
  - sensor:
      - name: "Pi-Radio CPU"
        unique_id: sensor.cpu_temp_pi_radio
        state: "{{ (states('sensor.cpu_temp_pi_radio_2') | float() / 1000) | round(1) }}"
        unit_of_measurement: "°C"
        icon: mdi:thermometer
        state_class: measurement
        device_class: temperature
Telegraf / Grafana
Another way to collect and monitor BPQ's SNMP metrics is by using Telegraf. You typically run Telegraf as part of a monitoring stack, in this case Telegraf + InfluxDB + Grafana.
In telegraf.conf:
[[inputs.snmp]]
  agents = ["udp4://localhost:161"]
  version = 1

# for each port...

[[inputs.snmp.field]]
  oid = "1.3.6.1.2.1.2.2.1.10.1"
  name = "port_1_octets_in"
  conversion = "int"

[[inputs.snmp.field]]
  oid = "1.3.6.1.2.1.2.2.1.16.1"
  name = "port_1_octets_out"
  conversion = "int"
These counters show up in InfluxDB under a measurement named SNMP with multiple fields, one for each oid.
Query like this:

End result:
