Table of Contents
XRouter Tour
The purpose of this “tour” is to give you an overview of what XRouter is like, without actually running it.
Other Pages In This Tour:
Local Sysop Interface 1
Xrouter is a text-mode program, which may be run in a Linux or Windows terminal. This page gives you an overview of the sysop interface. (If xrouter is run as a daemon, the sysop interface is only available via packet, telnet, http or XrMon)
If you start XRouter from a GUI environment, in this case the Raspberry Pi desktop, you will see something like this:
The operating system's GUI is not relevant to this tour and will henceforth be ignored. The bit we are interested in is contained within the terminal, in this case XRLin:
Status Window
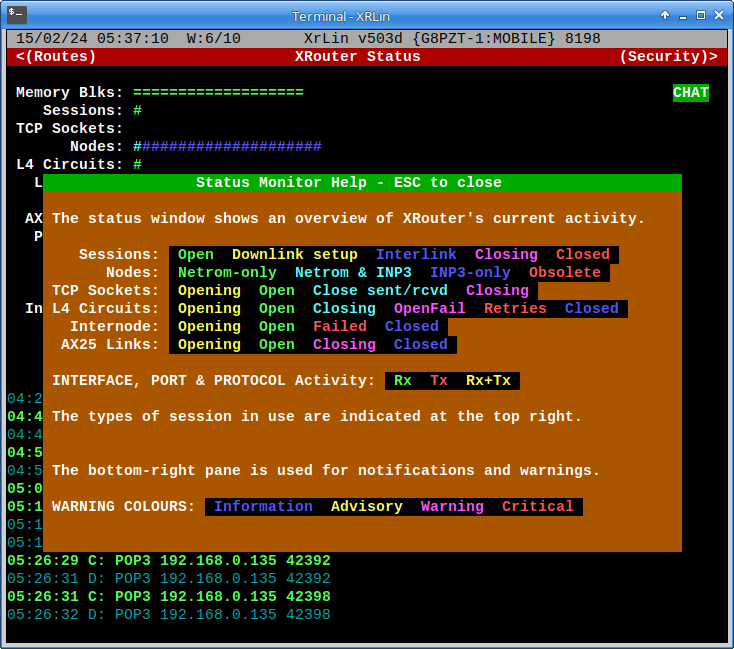
The above screenshot shows XRouter's “status window”. The caption “W6/10” indicates that it is window number 6 in a “carousel” of 10 text-mode “windows” forming the local sysop interface. It displays a general overview of the “health” and second-by-second activity of XRouter. The caption “PMS” flashes on and off when there is unread mail in the integral Personal Message System (mailbox). The protocol, interface and port indicators light up in different colours to indicate activity. Session indicators are displayed at the top right - In this case “CHAT” shows that a chat session is active.
By default XRouter starts on the status window, but it can be configured to start on any of the windows.
Help Panels
Pressing F1 on any of the windows opens up the help panel for that window, for example:
Let's have a quick look at the other windows before we have a detailed look at the “consoles”…
Sysop Chat Window
Window 1 (Sysop Chat) is an “always-on” chat window connected to XRChat channel 1234. This channel is used for instant messaging between XRouter sysops.
Chat Monitor Window
Window 2 (Chat Monitor) gives an overview of the currently active channels on the XRChat and RoundTable chat systems.
It also shows who is on each channel.
Session Monitor Window
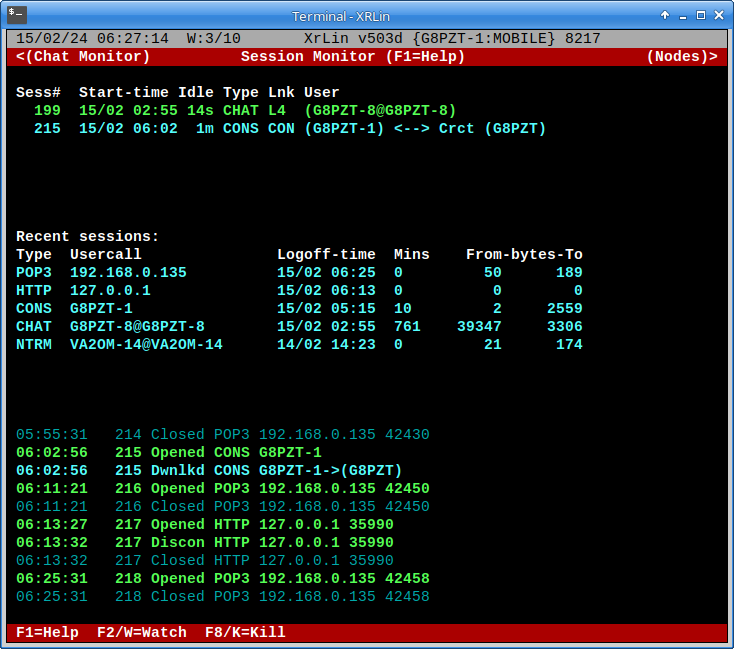
Window 3 (Session Monitor) shows who is currently connected and who has recently connected to your system. Additionally, it displays a log of the recent connections and disconnections:
F2 or Alt-W allows you to “watch” the activity of a specified session. F8 or Alt-K allows you to kill a session.
Nodes Monitor Window
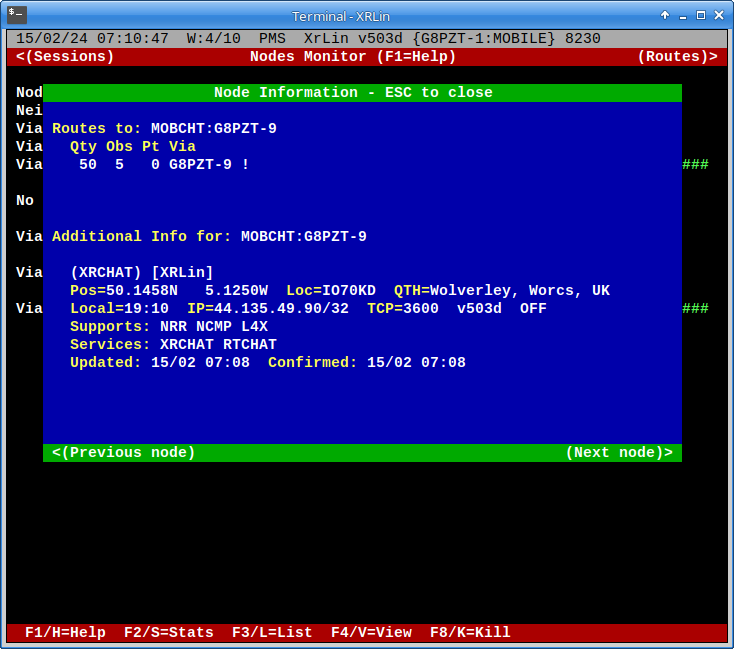
Window 4 (Nodes Monitor) shows how many NetRom nodes your system knows about, organised by hop count.
It also shows which routes they were heard via, and the “health” of each node is indicated by colour and shape of the characters:
Nodes Table Statistics Pane
F2 or Alt-S shows the nodes table statistics pane:
F3 or Alt-L displays a browseable list of all the nodes, or you can jump directly to a particular node using F4 / Alt-V[iew]
Nodes Browser Pane
Routes Monitor Window
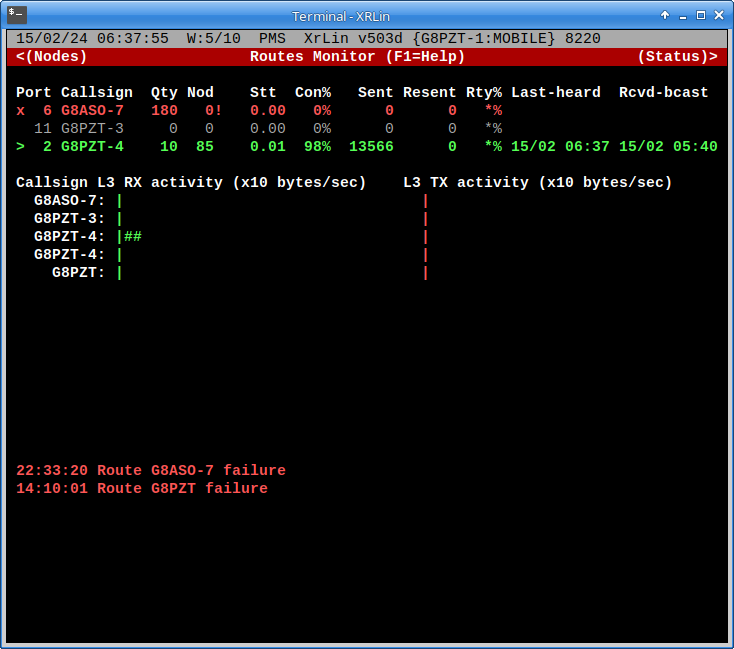
Window 5 (Routes Monitor) shows the status of the “Routes” to your NetRom neighbours.
You can see at a glance which routes are healthy and which ones might need attention.
Security Monitor Window
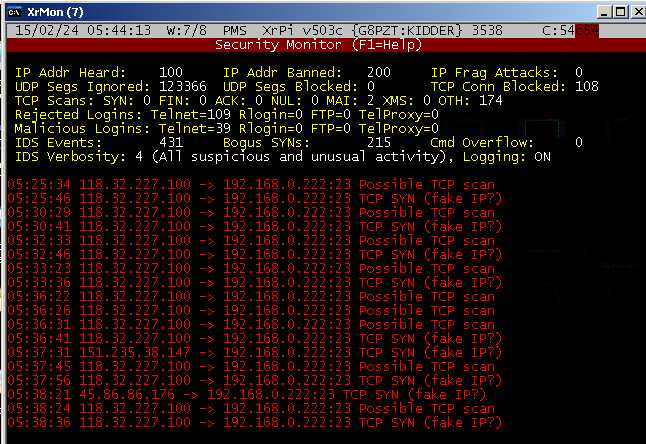
Window 7 (Security Monitor) summarises some of the findings of XRPI's Intrusion Detection System (IDS).
As my test system has no activity to show, the following example shows window 7 of XRPi being displayed remotely on a Windows system, using XRMon, which in turn is being viewed through a low-bandwidth VNC connection, hence the abysmal quality: (more on XrMon later)
Console Windows
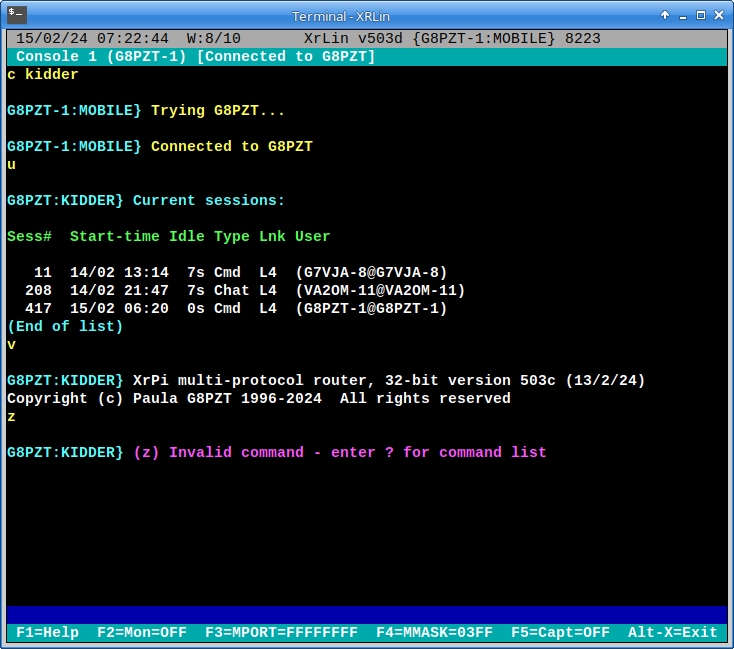
Windows 8 and above (if present) are “Console” windows, which allow you to interact with the software via a command line interface. You may configure 0 to 5 of these:
If you select one of the “console” windows, you can type commands to the software, monitor and capture protocol activity, and make connections etc. Consoles are ANSI colour compatible, and if you connect to another XRouter, that session is automatically in colour as the above example shows..
Packet Tracing
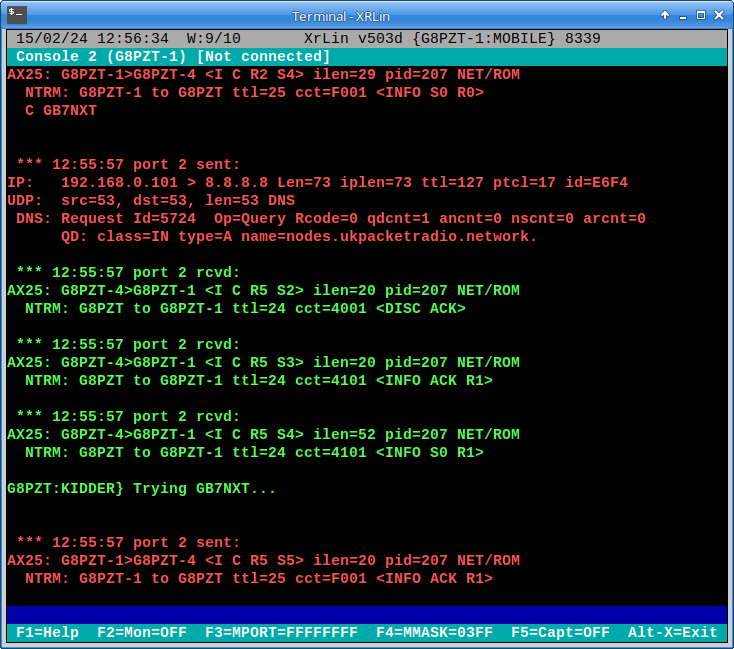
The F2 key toggles “monitoring” (tracing) on / off. You can select which port(s) and which protocol(s) to trace. The trace data can be captured to disk using F5..
Scroll-Back
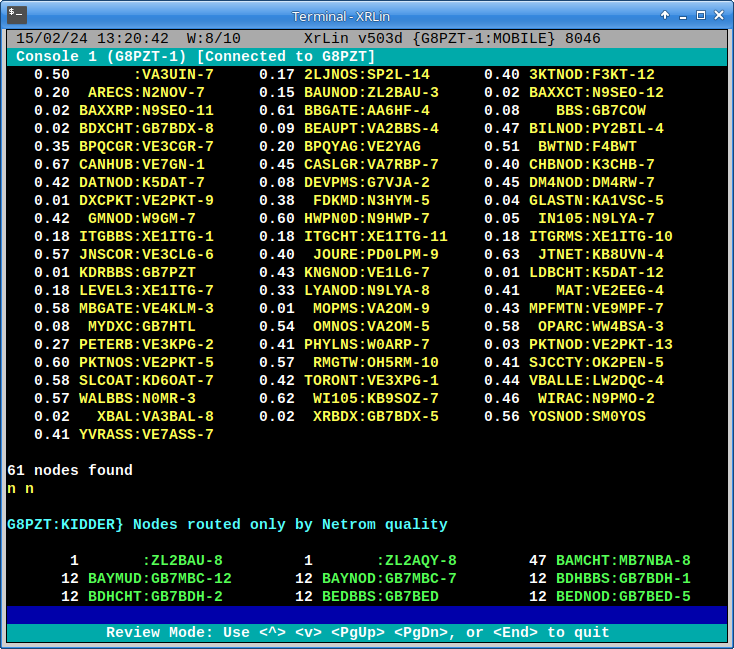
Using the up and down arrow keys, PgUp, PgDn, Home and End keys you can “scroll back” the console window to look at something that has gone off the screen. The default scroll buffer is 400 lines, but you can set it as large of as small as you like. If disk capture is enabled, it continues in the background during scroll-back:
Drop Down Menus
Instead of scrolling “left” and “right” through the carousel of XRouter windows, you can jump directly to a particular window using the “view” menu, invoked by Alt-V from any window, as shown below:
Hot Keys
Each menu option has a “hot key” highlighted in red, so for example to view the “Nodes Monitor” window, the sequence would be Alt-V followed by N.
Alternatively, use the up/down arrow keys to move the blue highlight bar to the desired option, then hit <CR> to action it.
File Menu
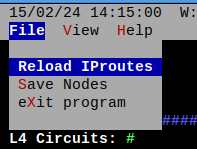 The file menu is accessed using Alt-F, or you can use the left and right arrow keys from an adjacent menu. There isn't much on this menu at present.
Help Menu
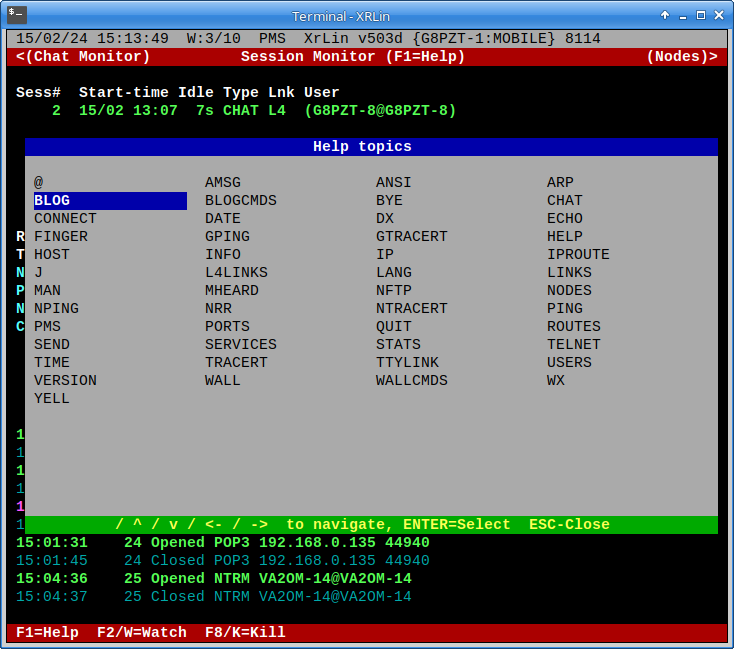
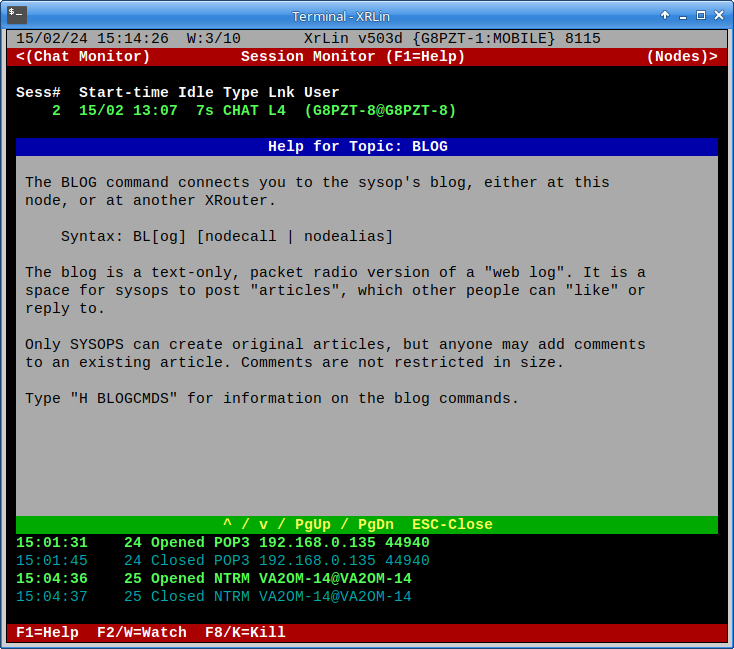
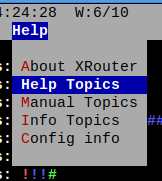 The help menu is accessed using Alt-H, or the arrow keys. The “Help Topics” option displays a panel with a scrollable list of the help topics.
Help Viewer
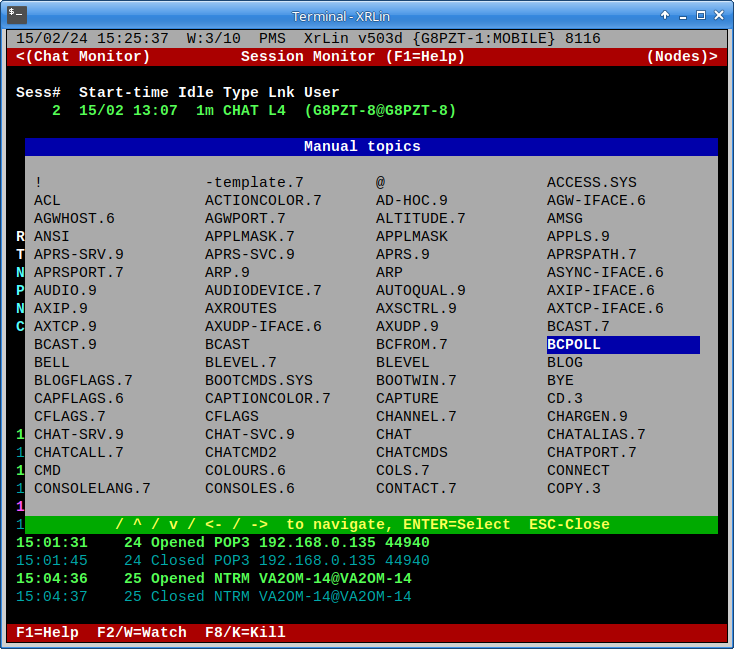
Manual Topics Browser
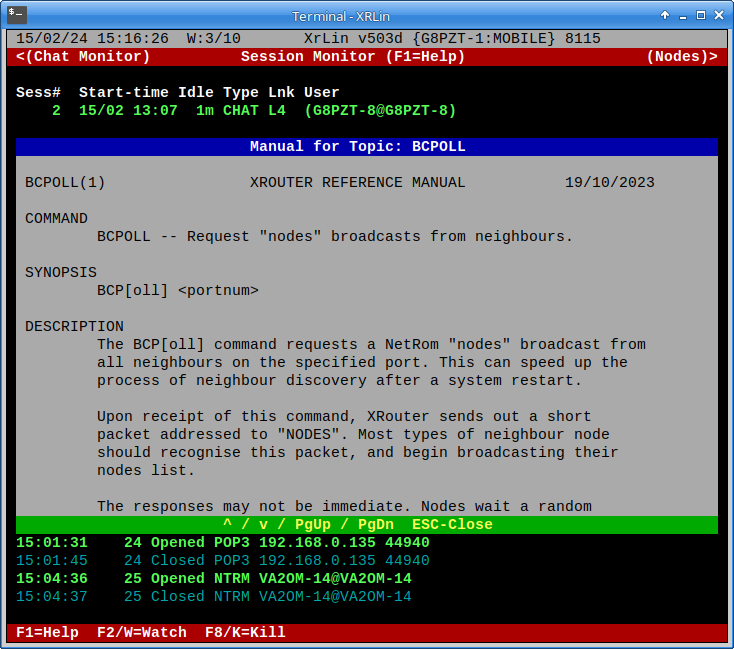
Manual Viewer
Configuration Viewer
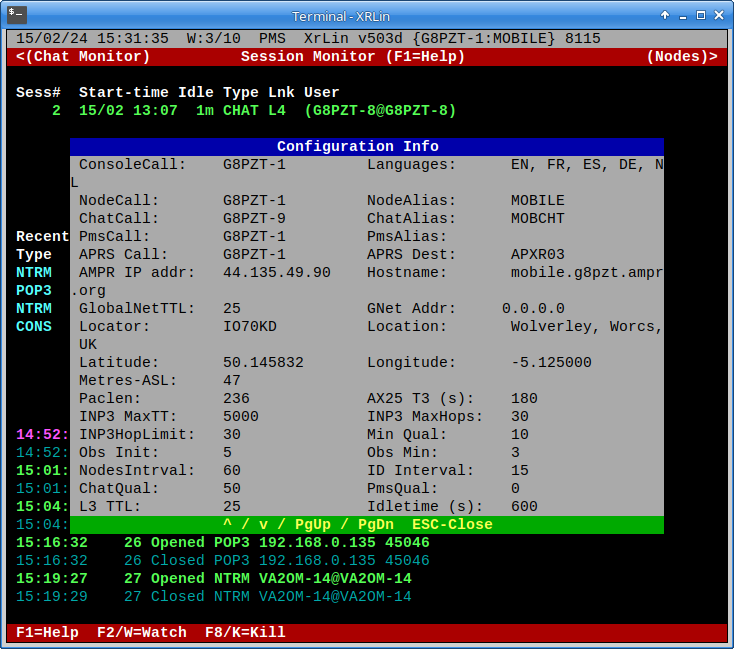
Finally, the “config Info” displays a handy summary of your node's configuration, again in a scrollable pane:
TELSTAR
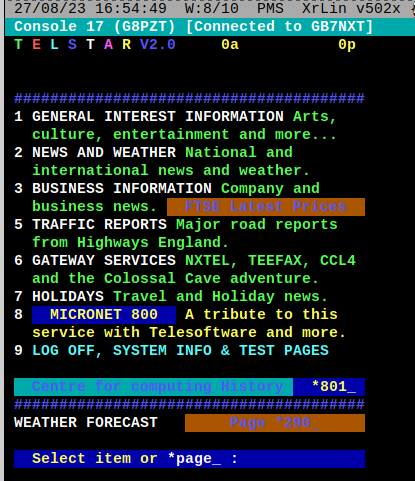
If you like a bit of retro, XRouter's console automatically decodes “teletext”-style pages from the Telstar app…
Alternate Languages
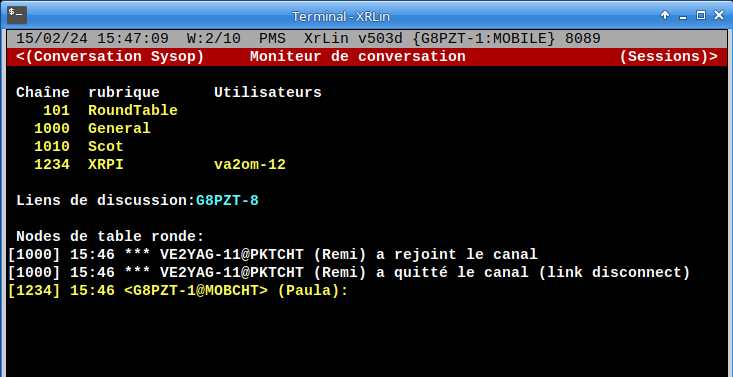
The console texts may also be configured for alternate languages:
Next we'll have a look at an alternative interface - xrmon


